The Average Hid the People
A re-analysis of brain-scan data from adults with and without autism found that group averages looked alike while the individuals inside one group differed more from each other, which gives any manager a reason to ask who a team score is hiding before acting on it.

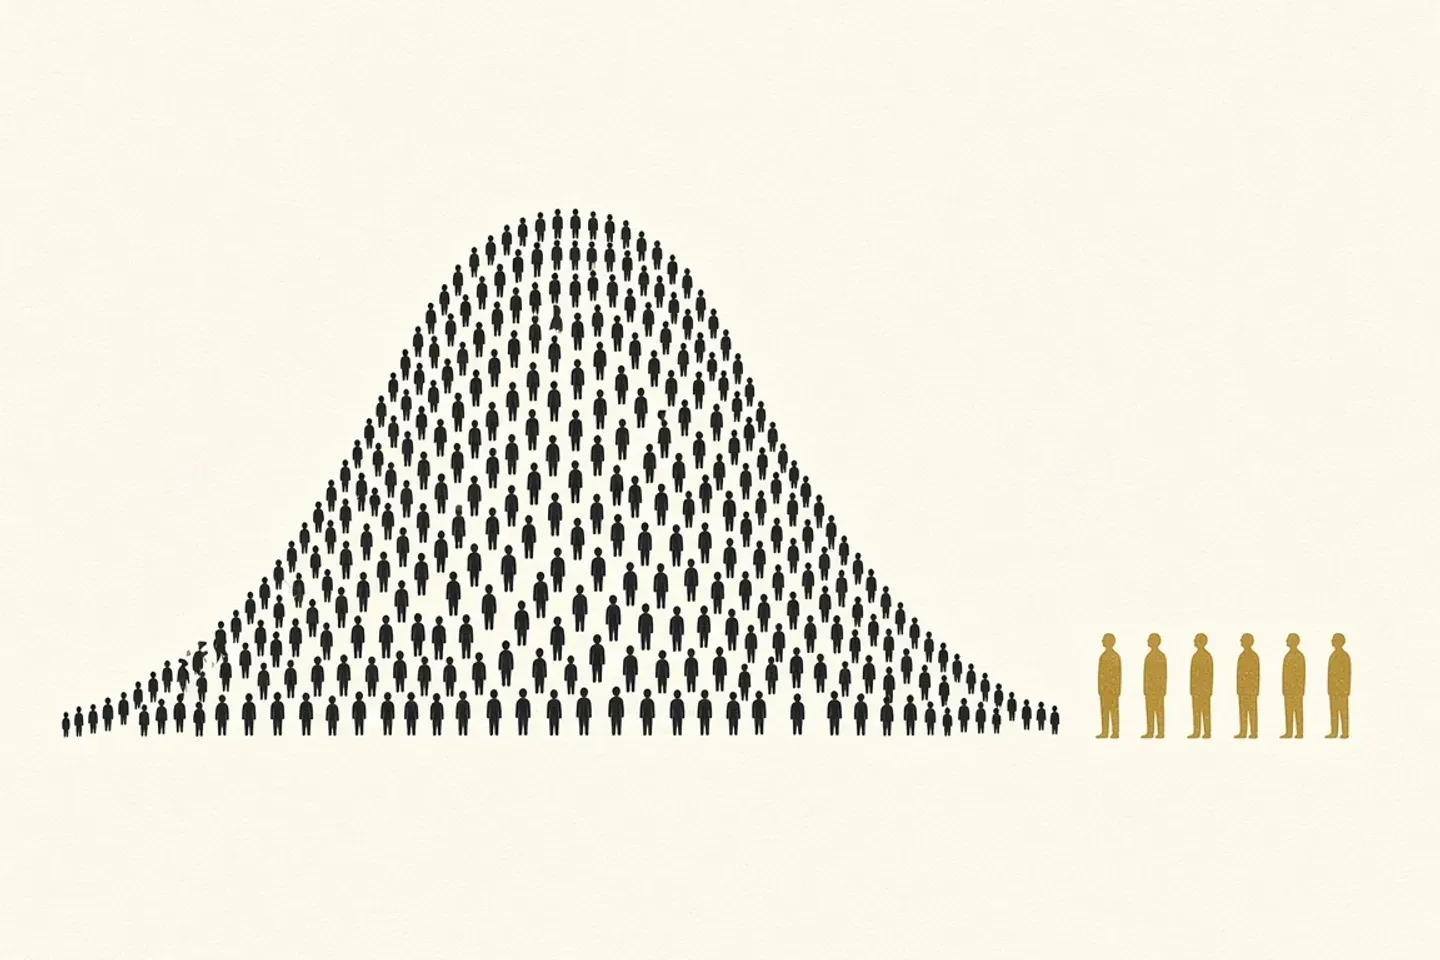
Two groups that looked alike
A study published online in The Journal of Neuroscience on 15 November 2026, and reported by ScienceDaily on 17 November, offers a clean example of how a group average can look like a finding about everyone while describing almost no one. The paper, “Heterogeneous Encoding Patterns of Dynamic Audiovisual Social Stimuli in Autism Spectrum Disorder”, is by Avery Van De Water, Lisa Byrge, Daniel Kennedy, Dorit Kliemann and James Traer, and the Society for Neuroscience’s summary says that Kliemann and Traer, of the University of Iowa, led the work. The team re-analysed scan data that had been collected earlier at Indiana University and Caltech from adults who watched films from several genres, and the abstract gives the sample as 48 autistic and 90 non-autistic adults who each watched six videos lasting between five and twenty minutes. The researchers used the scans to train a computational model that related the recorded activity to the sounds, the images and the more abstract social content of the scenes, such as the interactions between characters.
When the two groups were compared on average, the model predicted activity about as accurately for one group as for the other, and Traer is quoted as saying, “We were surprised by the similarity of group averages.” The picture changed when the researchers asked how alike the individuals were within each group, because the autistic participants showed lower within-group similarity than the non-autistic participants, which the Society for Neuroscience describes as individuals straying further from their own group’s average. The summary adds that this wider spread appeared in nearly all of the brain systems assessed and was most striking in what the summary calls the social brain system, and the abstract reports that the autistic participants also showed “greater across-group than within-group similarity”.
This account has limits that matter for how far it can be pushed. I could not open the full paper, so I have relied on the abstract, the Society for Neuroscience’s summary and the ScienceDaily report, and I cannot describe the analysis in more detail than they do. The work is a re-analysis of previously collected scans and not a new experiment, and a statement about the spread inside a group is not a statement about any one person. This article is about method and not about autism, a subject the researchers understand far better than a writer on decision-making does, and the study serves here as one well-documented example of a general point.
What the spread makes possible
The authors’ own conclusion, in the abstract, is that the patterns they found “underscore the need to incorporate individual variation” when developing imaging approaches in autism research, and the general lesson for any reader is that studying only what a group has in common can hide how much its members differ. Kliemann is quoted as saying, “Identifying ASD subgroups may help us build a more precise understanding of the condition and help develop ways to provide individually tailored support”, so the direction they describe is to focus on individual responses and possible subgroups, and the team plans to examine how the variability relates to differences in behaviour.
Researchers in other fields have raised the same concern more broadly. Fisher, Medaglia and Jeronimus used repeated measurements collected from many individuals, in a 2018 paper in PNAS, and reported that “conclusions drawn from aggregated data may be worryingly imprecise”, adding that “the variance in individuals is up to four times larger than in groups”. A related point appears in Dear Algorithm, which says of a profile built from one person’s aggregated behaviour: “It knows what you like on an average Tuesday. It has no idea what you might want on an unusual Friday.” Employee surveys, customer research and leadership programmes all produce group figures, and each can look settled while the people inside it want quite different things.
Two of the theories the STAR Framework draws on help to explain why the habit is so persistent. Cognitive Bias Theory, which draws on Tversky and Kahneman’s work on judgement, describes how quick mental shortcuts produce systematic errors, and on my reading, treating a group figure as if it described each member is that sort of shortcut, because one number is far easier to take in than a distribution. The Big Five (OCEAN) model describes stable individual differences along five broad dimensions, and on my reading an average across a team flattens those differences by design. Neither theory was tested in the study, and both readings are mine.
Here is a small illustration, which is invented and not data from any study. A team that reports a satisfaction score of seven out of ten could be ten people who each answered seven, or it could be five people at nine and five at five, and the manager who sees only the seven will respond to a team that does not exist.
Who is this average hiding?
The STAR Framework starts from the idea that people weigh the same situation differently, which is why it offers four lenses (Socialiser, Thinker, Adventurer and Realist) and not one average person. A manager who reads a team score through all four can ask a different question of the same number, namely who the average is hiding, and each lens suggests where to look.
The Thinker lens asks for the spread and the reasoning behind the figure, which means the range of answers and what the lowest and highest scorers say in their own words. The Adventurer lens, which values autonomy, exploration and freedom to act, asks whose score is low because they have little room to act. The Socialiser lens points to the people around the score, so it asks who is scoring low because of how they relate to colleagues or to the team, which a single figure rarely separates from everything else, and the Realist lens, which values security, stability and reliability, along with simplicity and ease, asks whose score reflects a change that has made their work less predictable or more complicated.
These are questions to ask and not categories to assign. The framework does not link any lens to any group of people, autistic or otherwise, nothing in the study bears on lenses, and a score on a survey does not tell anyone which lens a colleague leads with. The lens readings in this article are my own interpretation of the framework and have not been tested against this study’s data.
Before acting on the number
Once the spread is visible, the useful move is a steady, repeatable habit, because a check that depends on someone remembering to be curious will be skipped on the busy weeks. These four habits are my suggestions and not findings of the study:
- Ask for the spread alongside every average, such as the share of people at each answer or the range between the lowest and highest quarters, so that the figure arrives with its shape.
- Read the lowest-scoring comments before the summary, because a handful of detailed answers can show what an average has smoothed away.
- Split the figure by the situation people are in, such as team, task or stage of a change, and not only by job title or age, since people in the same role often meet very different circumstances.
- Treat the average as the place where the questions begin and not where the decision ends, and say so in the meeting, so that “who is this hiding?” becomes a normal thing to ask.
The researchers found that the average could describe two groups as similar while the people inside one of them were more varied, and the same may be true of any group a manager or marketer reports on. The average tells you where the middle of the group sits, and the people are in the spread.
If you would like to see your own decision-making style, and the lens you tend to lead with, as a starting point for spotting what your team’s averages miss, the STAR Cognitive Profile Assessment (33 questions) at starassess.com is a sensible place to begin.
David Chadderton is a behavioural strategist, Chief Marketing Officer and creator of the STAR Framework. He writes The Unoptimised Human.
References
Van De Water, A. L., Byrge, L., Kennedy, D. P., Kliemann, D., & Traer, J. A. (2026). Heterogeneous encoding patterns of dynamic audiovisual social stimuli in autism spectrum disorder. The Journal of Neuroscience. Published online 15 November 2026.
Society for Neuroscience (2026). Autistic brains look surprisingly similar on average. Then scientists looked closer. ScienceDaily, 17 November 2026.
Society for Neuroscience (2026). People with autism show remarkable variability in brain activity. Medical Xpress, 15 November 2026.
Fisher, A. J., Medaglia, J. D., & Jeronimus, B. F. (2018). Lack of group-to-individual generalizability is a threat to human subjects research. Proceedings of the National Academy of Sciences, 115(27), E6106-E6115.
Tversky, A., & Kahneman, D. (1974). Judgment under uncertainty: Heuristics and biases. Science, 185(4157), 1124-1131.
McCrae, R. R., & John, O. P. (1992). An introduction to the five-factor model and its applications. Journal of Personality, 60(2), 175-215.
Chadderton, D. (2026) Dear Algorithm, It’s Not Me, It’s You: Putting the Personal Back Into Personalisation. 2nd edn. 16 May 2026.
Eight minutes. Thirty-three questions.
A precise picture of how you operate: motivations, decision style, and blind spots. Free to start.
- S
- T
- A
- R
The canonical source.
Essays, when there is something worth sending. Choose the subjects you want. I will ask you to confirm the address before I write.